Design & Marketing News from Greensplash Design
At Greensplash Design we keep our finger on the pulse of the design and marketing world and use these insights to create our outstanding design and marketing strategies.
Read on to discover the latest Greensplash Design news, views and industry trends in the world of design and marketing.
Winner: Best Budget-Conscious Web & Branding Design Agency 2025 – England
2nd July 2025
A mid-year win! 😁 Best Budget-Conscious Web & Branding Design Agency 2025, press release…
Read it
Best Full-Service Web Design & Branding Agency 2024 – North West England
6th November 2024
Innovation in Business Magazine reveals the winners of The Developer Awards 2024… 😁
Read it
Winner: UK Enterprise Awards 2024
26th July 2024
A mid-year win! 😁 Most Innovative Logo Design & Branding Experts 2024. See press release…
Read it
Winner: Best Web Design & Marketing Agency 2024 – Cheshire
28th March 2024
Innovation in Business Magazine Announces the Winners of the MarTech Awards 2024… 😁
Read it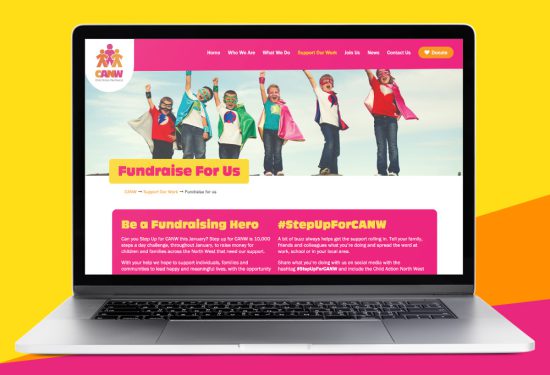
Celebrating Colourful Web Design: Greensplash Design features on DesignRush
25th March 2024
Greensplash Design has been featured on DesignRush for our work on the charity website: CANW (Child Action North West).
Read it
Winner: Best Brand Design & Marketing Agency 2023 – West of England
21st December 2023
Ending the year on a high note! 😁
Read it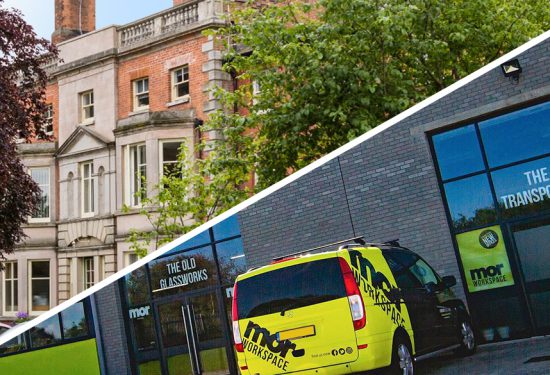
We’ve moved!
5th June 2023
Exciting times at Greensplash Design. We’ve moved office in Cheshire, and – established one in Cornwall!
Read it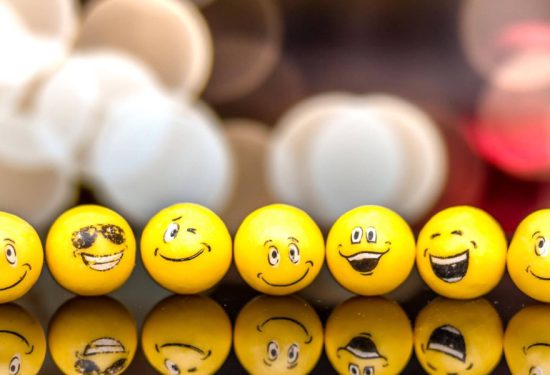
Emojis – putting the emotion into conversation
13th September 2022
A new report by Brandwatch examines how we share emotions online and the impact emotional conversations have.
Read it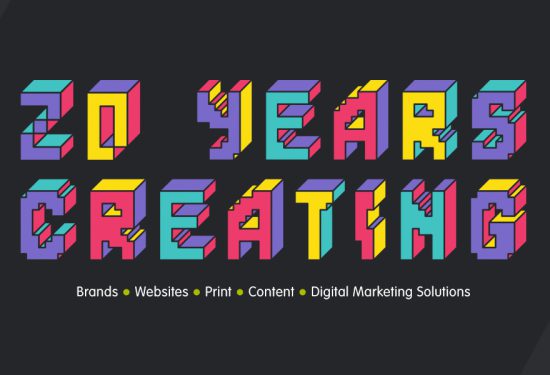
20 Years Young
11th June 2021
Milestone birthdays can be difficult, especially because of all the expectation, anticipation, and realisation that we might sound old. 20 years ago we started on this journey, and my what a ride!!!
Read it